Upstat

  • Our product
  • Live
  • Web

Uptime monitoring and public status pages for websites, APIs and servers.

Upstat

About the project

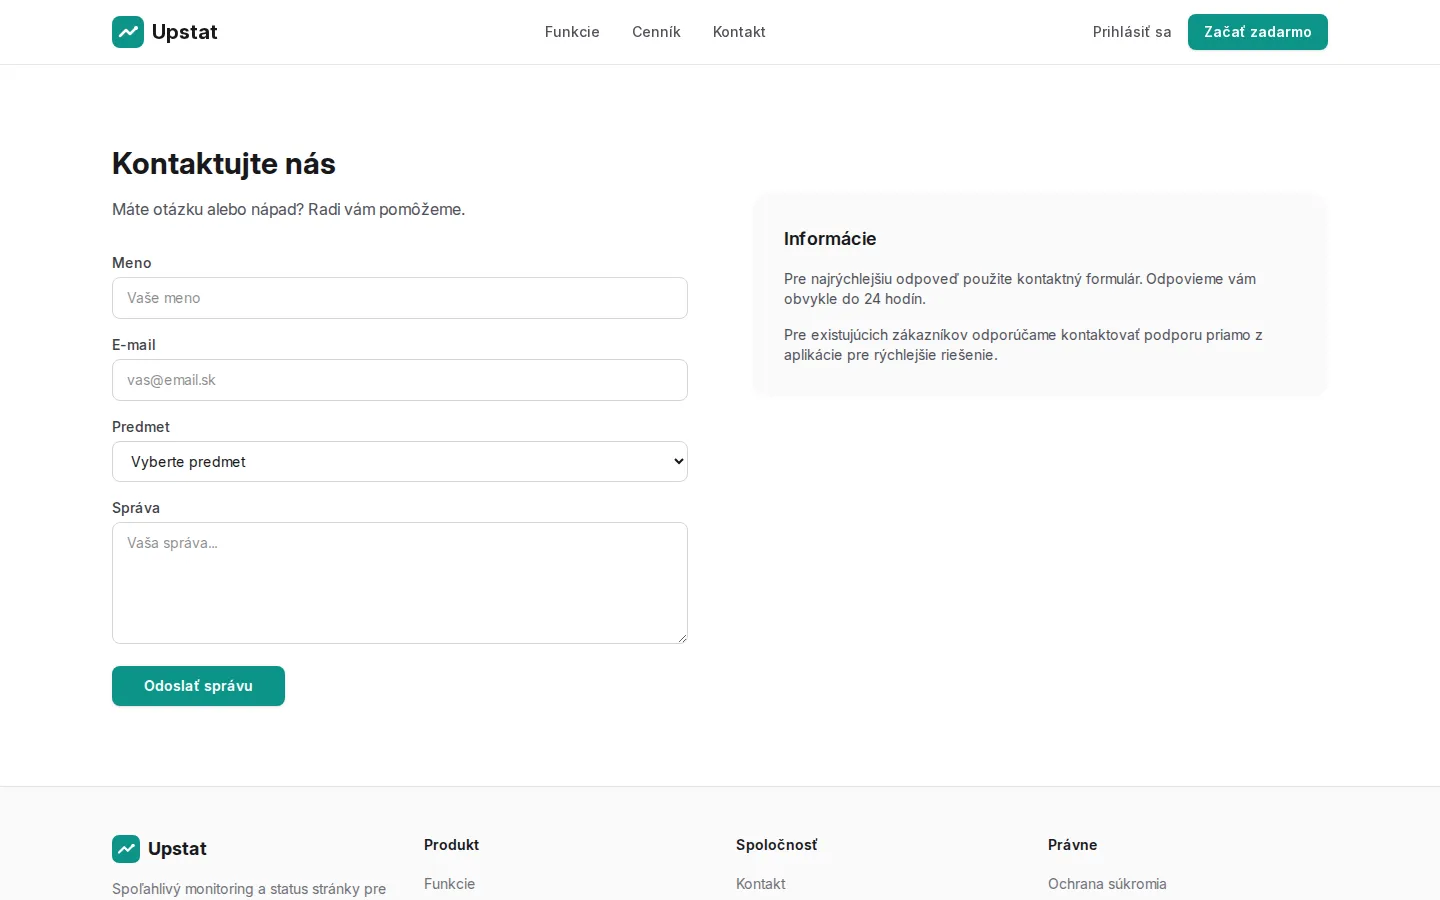
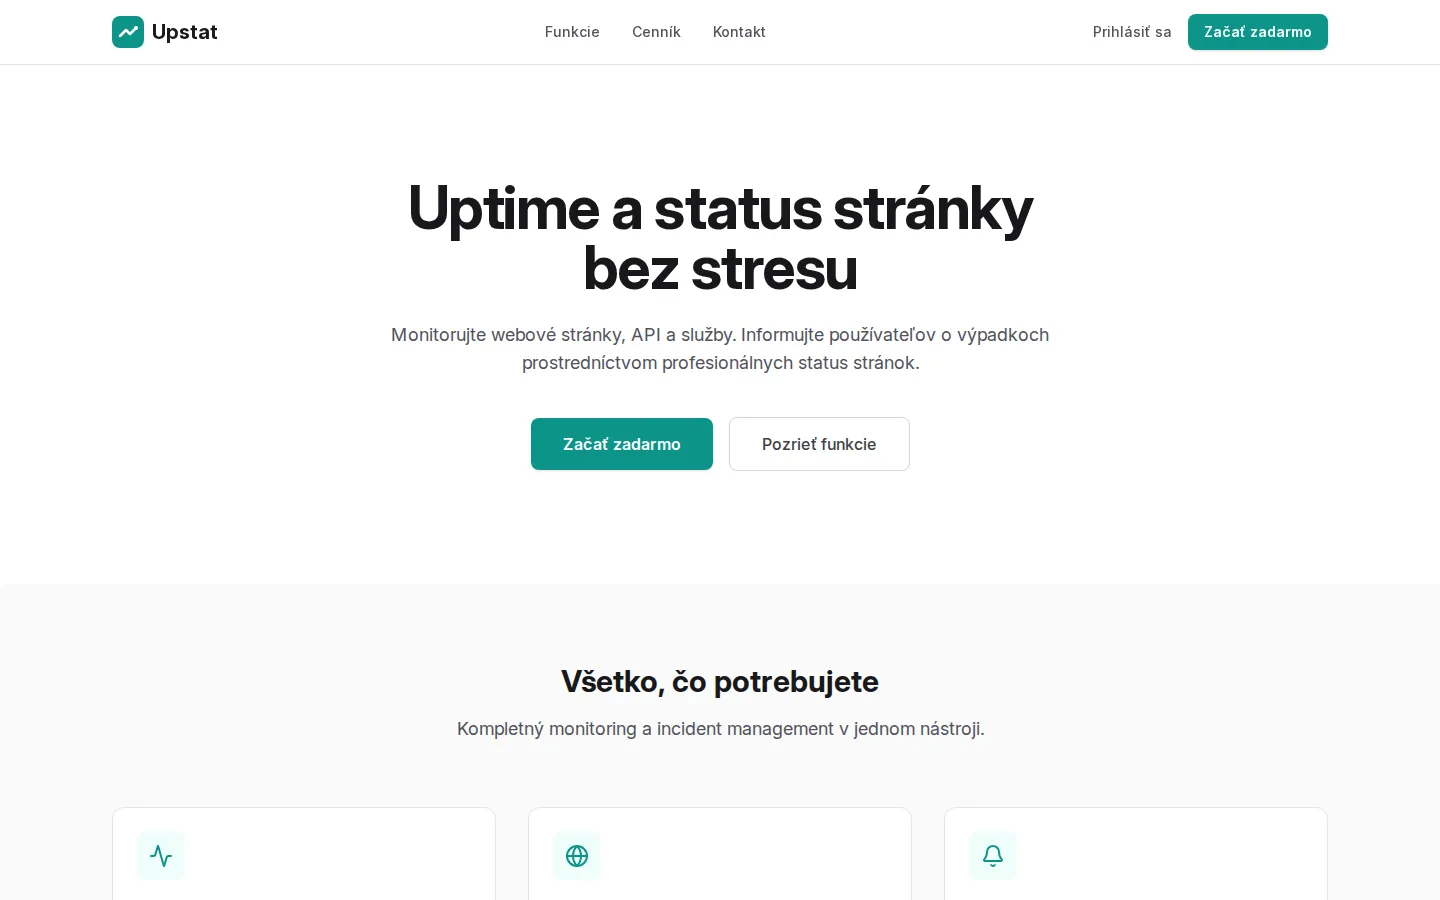
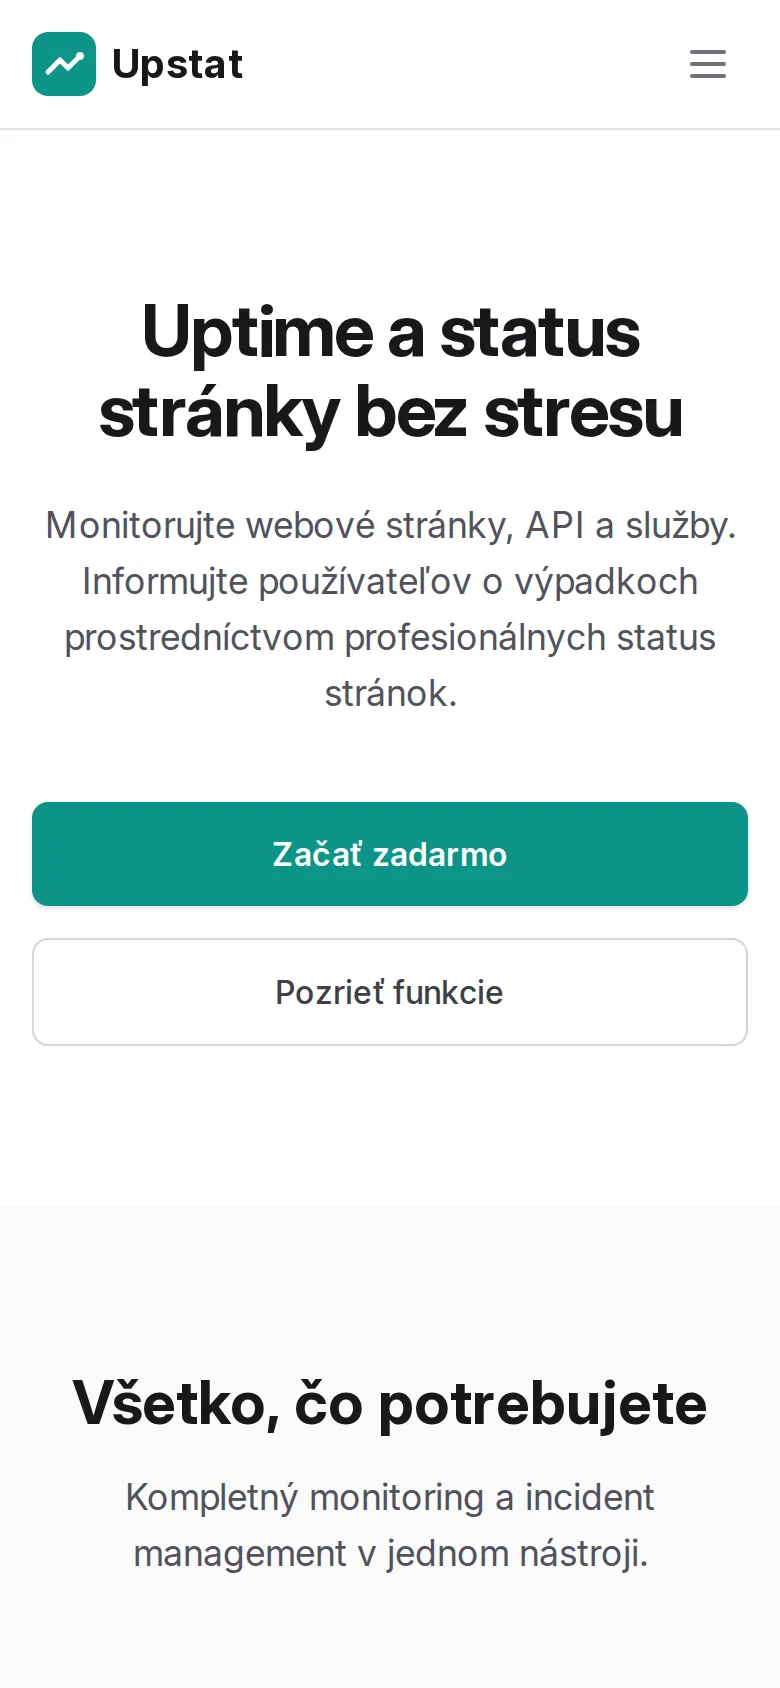
Upstat monitors websites, APIs, SSL certificates, ports, databases and Docker containers and reports outages through status pages and notifications. It has three pricing plans starting with a free Hobby plan, a REST API, team management and card payments through Stripe. The interface is in Slovak.

What Upstat does

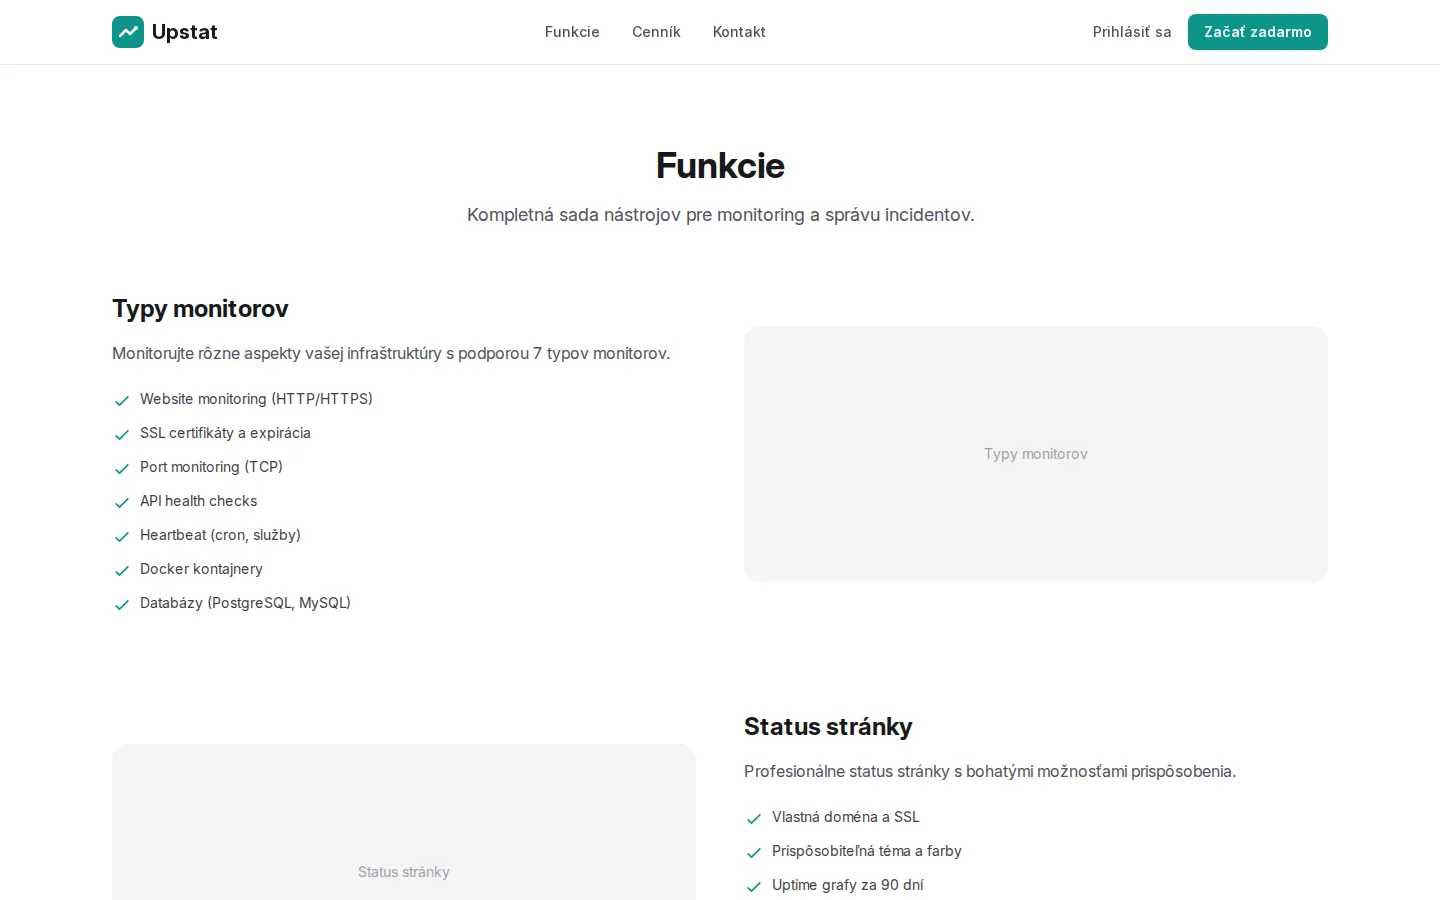
  • Monitors seven types of targets: HTTP/HTTPS websites, SSL certificate validity, TCP ports, API health, heartbeats for cron jobs, Docker containers and PostgreSQL and MySQL databases.
  • Public status pages with a custom domain and SSL, a custom theme and colours, 90-day uptime charts, automatic incidents, subscriptions by email or webhook, several languages and password protection.
  • Notifications to Slack, Discord and Telegram, by email, SMS, push notification and webhook, with threshold rules and escalation by outage duration.
  • Team management with the roles owner, admin, member and billing, email invitations, an audit log of changes and support for multiple companies.
  • A REST API with tokens with custom permissions, outgoing webhooks and OpenAPI documentation.
  • Billing through Stripe with monthly and annual plans, SMS credit top-ups, downloadable invoices and a GDPR data export.

Pricing plans

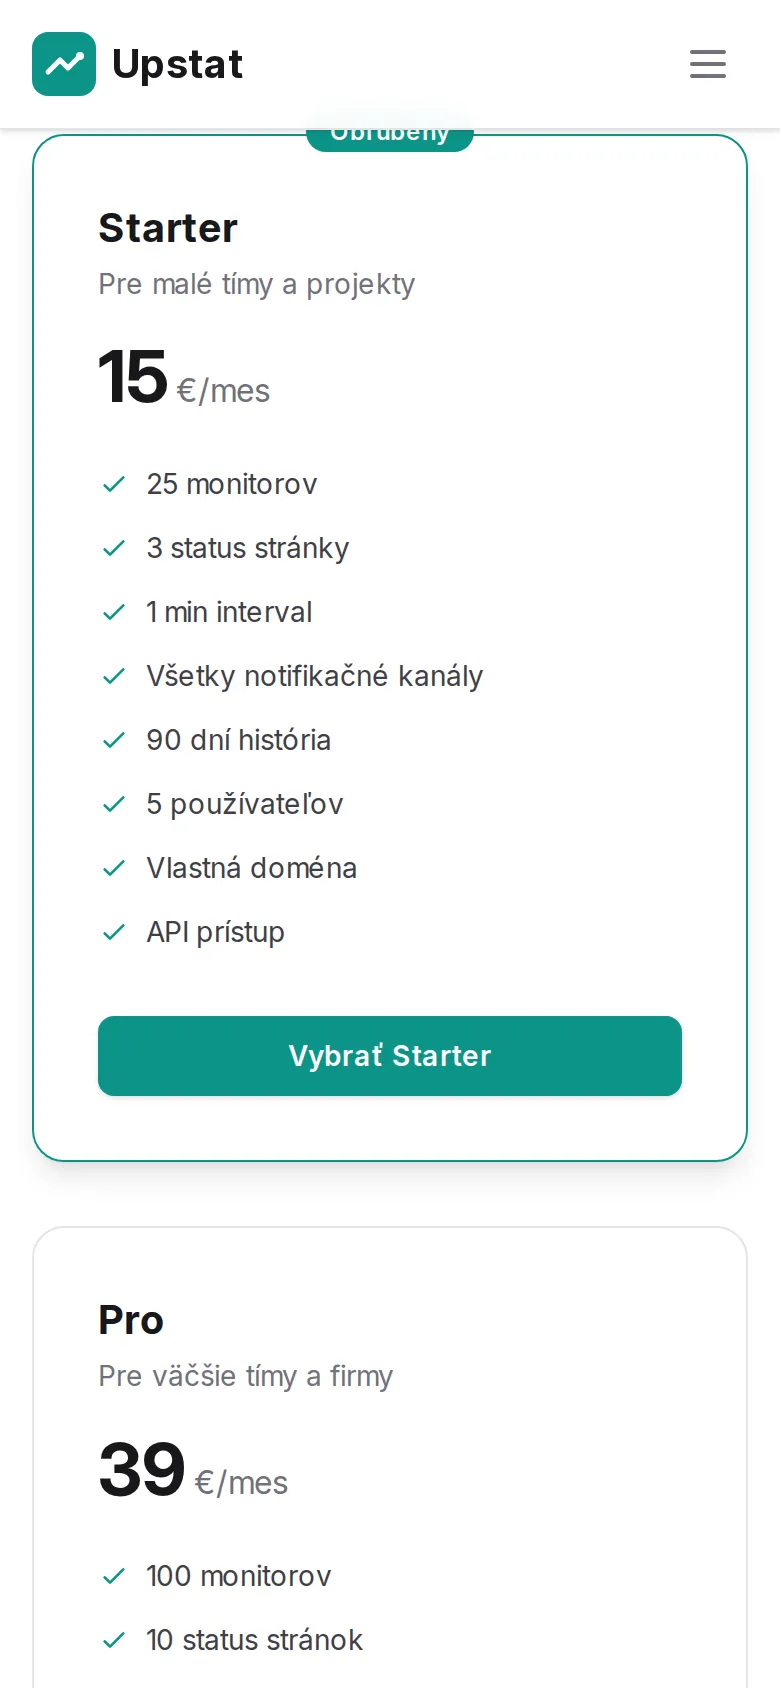
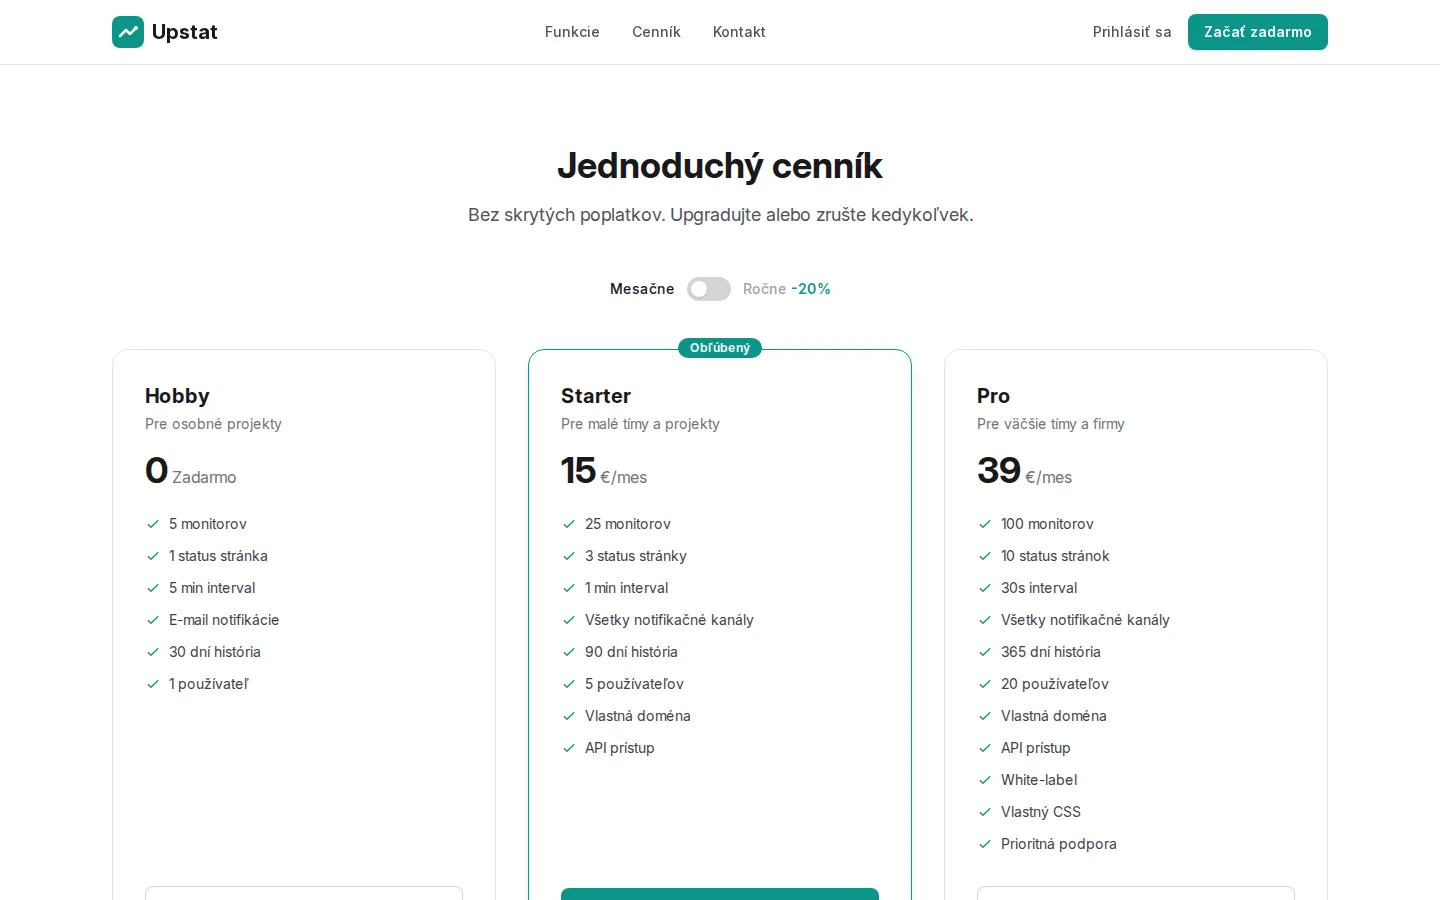
The Hobby plan is free: 5 monitors, a 5-minute check interval, one status page, 30 days of history, email notifications and one user. The Starter plan costs 15 EUR per month: 25 monitors, a 1-minute interval, 3 status pages, 90 days of history, 5 users, a custom domain and API access. The Pro plan costs 39 EUR per month: 100 monitors, a 30-second interval, 10 status pages, 365 days of history, 20 users, white-label, custom CSS and priority support. Annual billing is discounted by 20%.

Who it is for

For teams that run websites, APIs and servers and want to learn about an outage before their customers do, and for companies that want to show customers a public status page with uptime and incidents.

How it works

A user adds a monitor, connects notification channels and creates a status page. The checks are executed by a separate daemon written in Rust, which takes jobs from the application and sends results back, while the application decides on state changes and incidents.

Technology

The application runs on Laravel 12 with Blade and Vue, and data is kept in PostgreSQL and Redis. The checks run in a Rust daemon.
Gallery

Technologies Used

Laravel Vue.js Rust PostgreSQL Redis

Have a Similar Project?

Get in touch and let's discuss your ideas.

Contact Us